Worksheet
All the calculations are performed on the SCM Forecast page.

Historical Data
The steps to calculate the forecast are
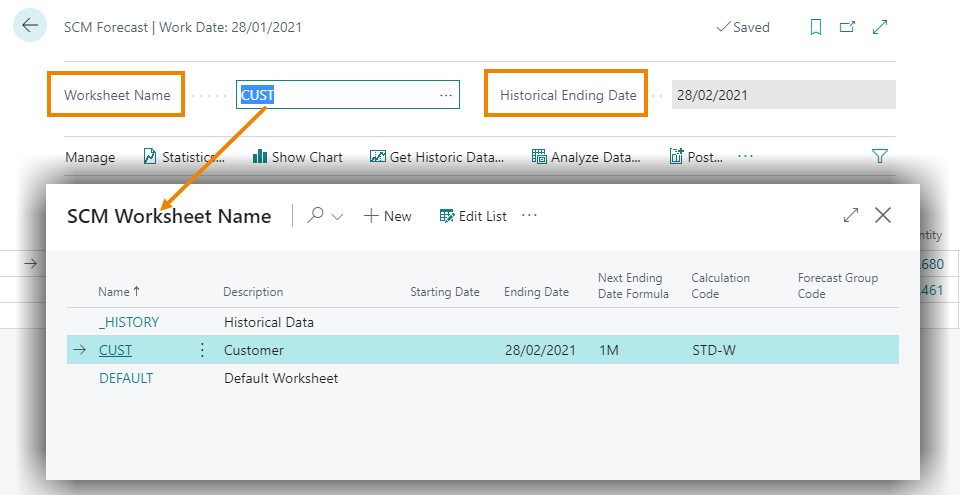
You need to choose Historical data for a specific period. The Period to analyze is defined on the worksheet in the field Historical Ending Date:
From Get Historic Data the system calculates and shows the data
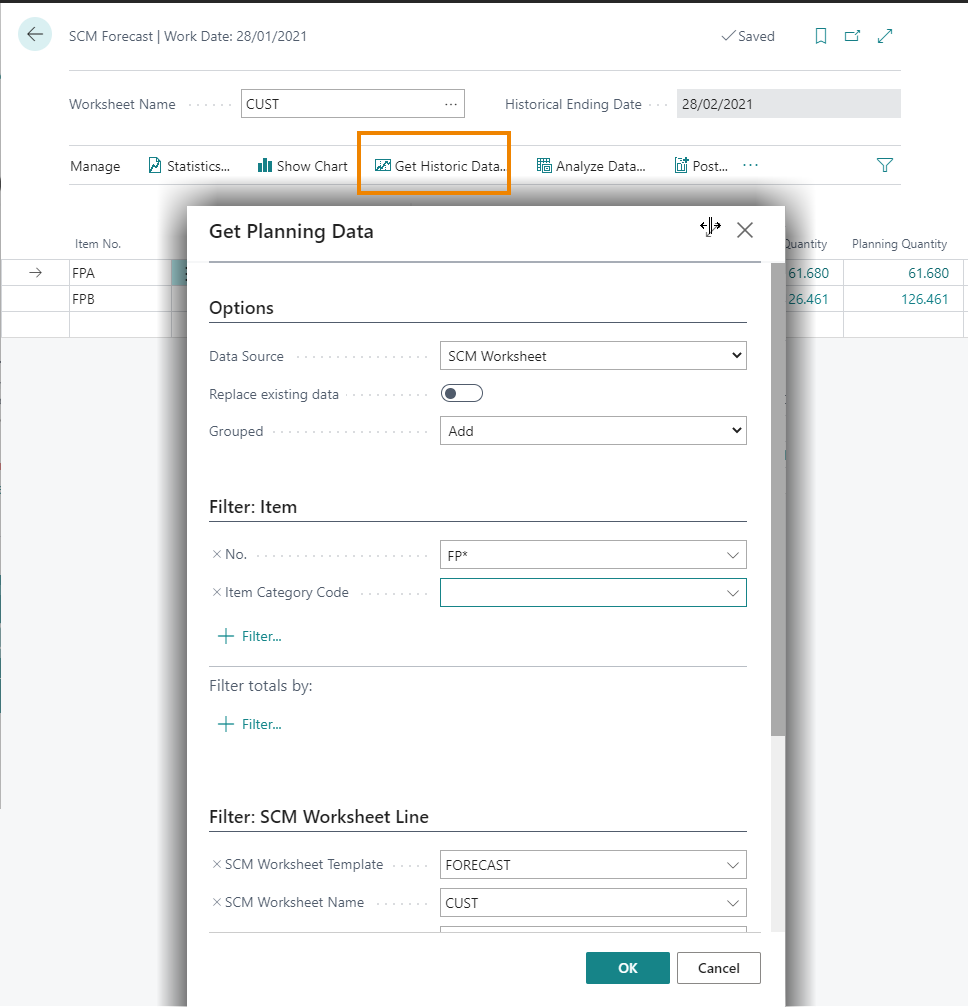
| Field | Description |
| Data Source | Item: select a specific item SCM Worksheet: get the historical data relating to the items already on the worksheet |
| Replace Existing Data | Enable it if you want the system to replace data already in the worksheet with the new data |
| Grouped | The system Replaces or Adds data grouped for week, month, quarter, year |
You can set item filters, for example "Finished Product" as indicated in the image and click OK. The system will analyze the sales ledger entry until the date indicated in the Historical Ending Date field and perform the request (the calculation of the historical data can be scheduled on the job queue).
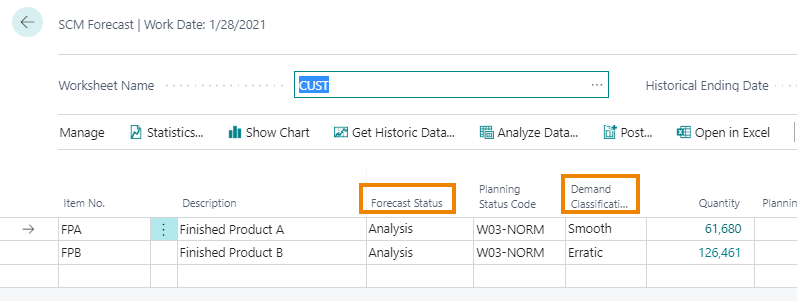
The system has calculated and also analyzed the historical data entering the fields Planning Status Code and Demand Classification.
Thanks to the app you can get historical data and analyze them to find out data patterns:
-
Distribution of data: normal, seasonal, sporadic
-
Smoothing (excludes outliers, e.g. sales actions)
-
Demand classification
| Field | Description |
| Quantity | Actual quantity of items |
| Planning Quantity | Quantity of items not considering promotions or outliers |
Demand classification
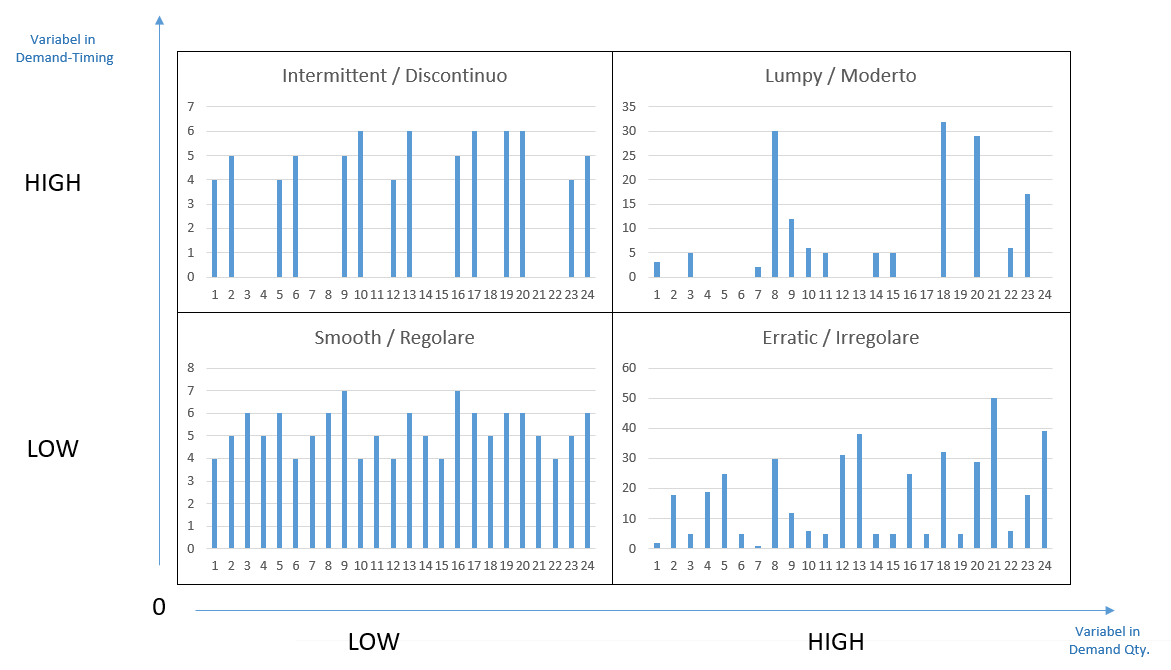
Not for all items it is possible to calculate the forecast with statistical formula.
For a perfect calculation the optimal situation is when data are Smooth (regular in quantity and over time).
The Forecast calculation with statistical formulas is difficult for Erratic data (very variable over quantity, but not in time).
The Intermittent data are variable over time, the quantity is almost always the same (e. g. seasonal items).
Lumpy data are variable both over quantity and also over time, so it is difficult to determine a forecast with statistical formulas. Other methods are needed.
Data Statistics
Data interpretation is very important.
From Show chart you can see the data History:
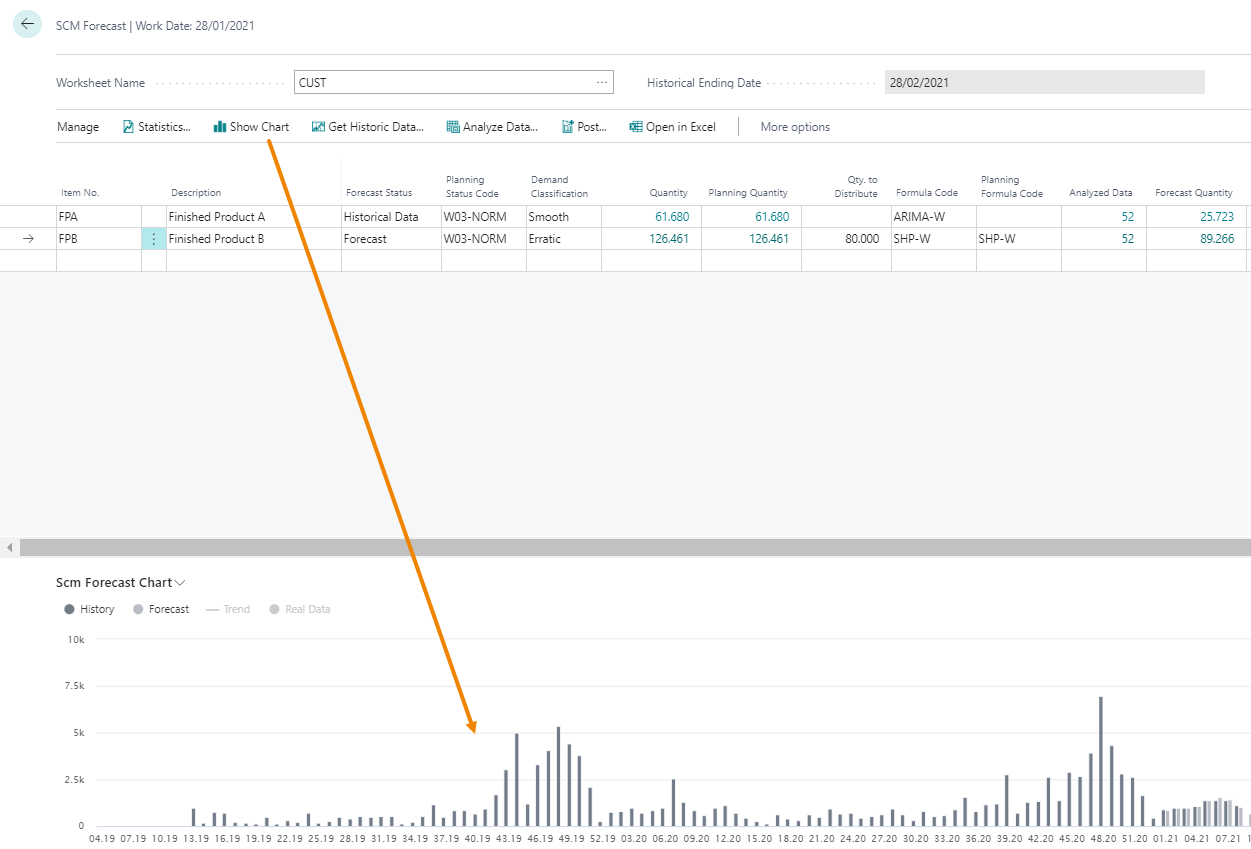
in the example the system show the Finished Product B wich is classificated as Erratic: sales spike in the end of the year (in the picture 2 years are considered).
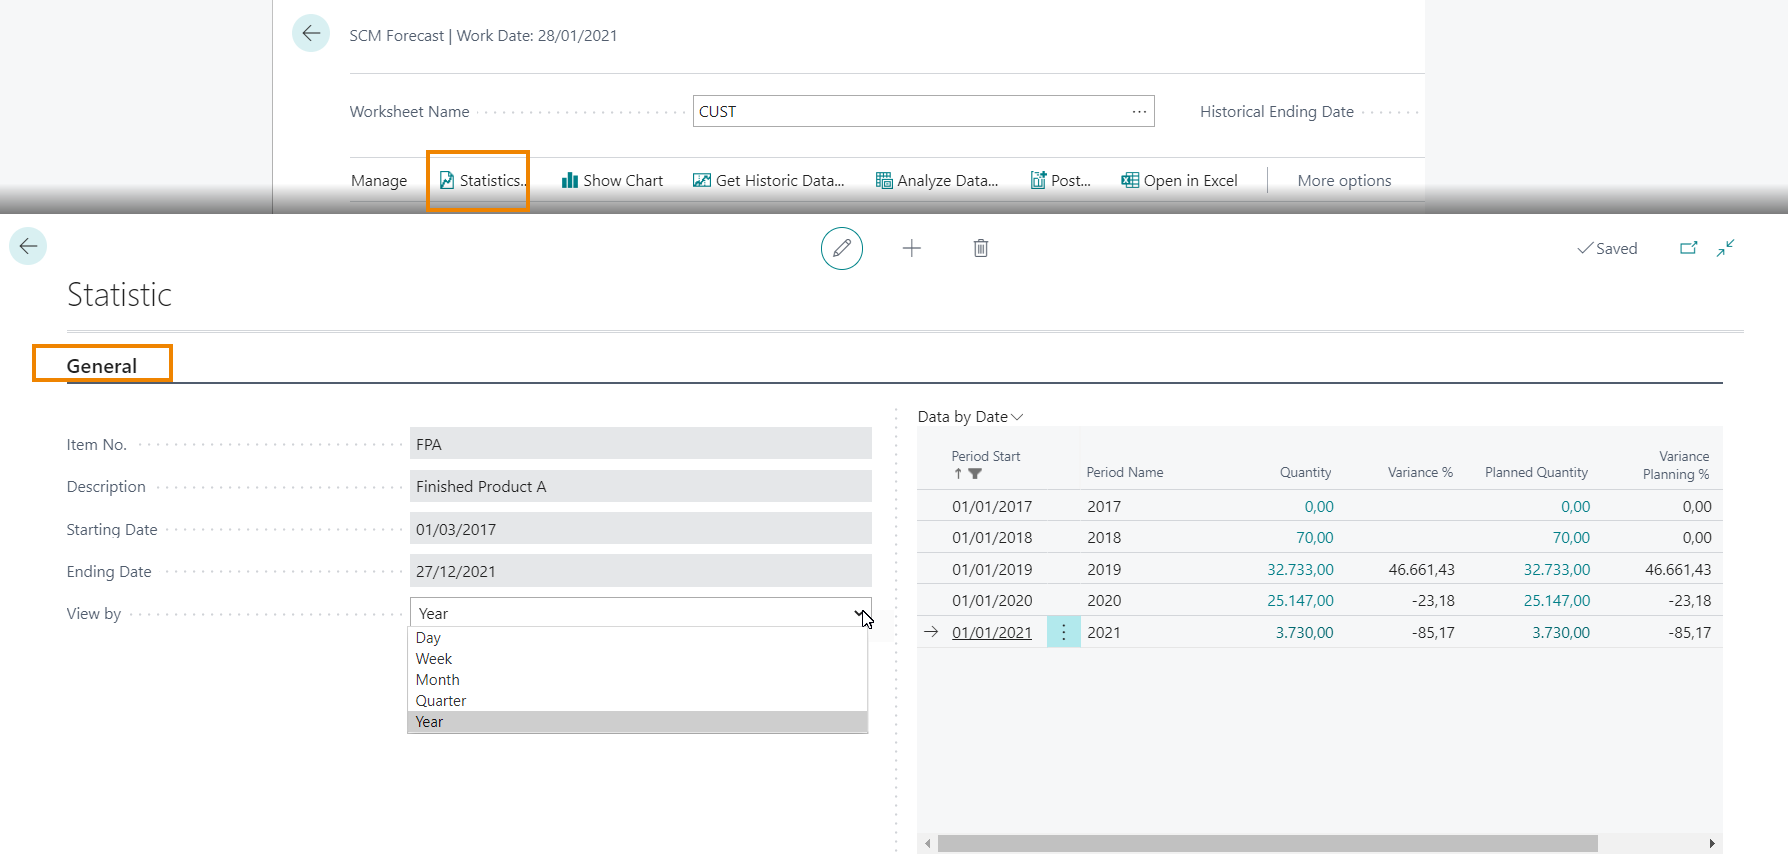
From Statistics we can have more details. In the General tab the system shows an overview on sales. You can choose to view data by Day, Week, Month, Quarter or Year:
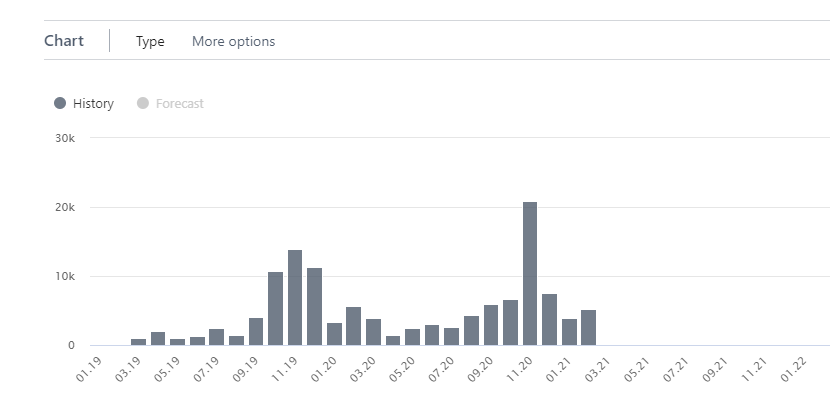
In the Chart tab we can see the chart already examined in the previous page (it changes by selecting "View by" Day, Week, Month, Quarter, Year).
If data have been smoothed, pressing "Real Data" we can see the original data.
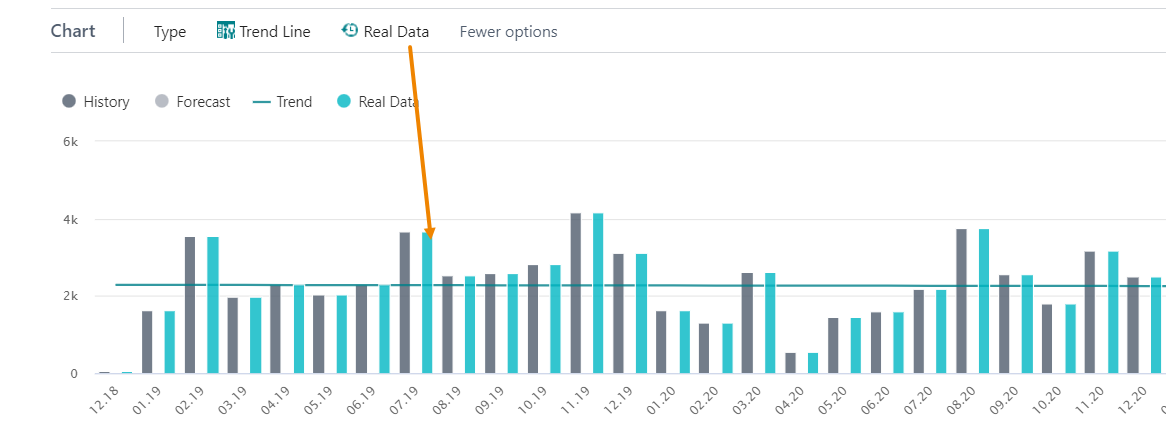
Moreover, the Trend line shows the sales trend for the finished product examinated.
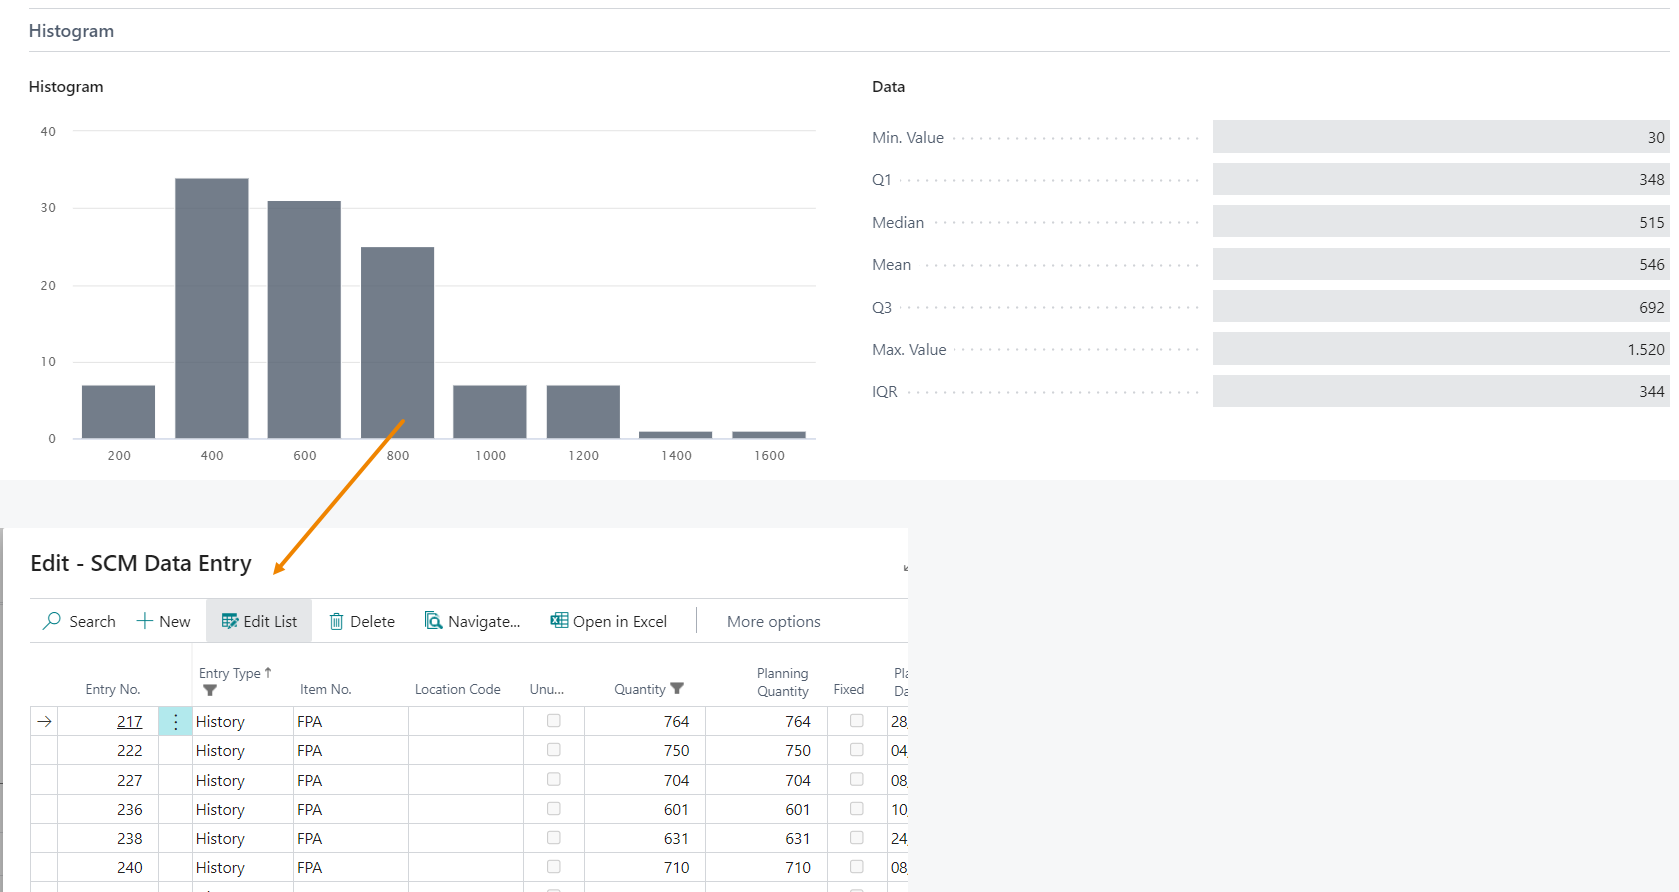
In the Histogram tab the system shows more informations about sales. By clicking on the histogram you can see the details:
Analyzing the data, the system will examine all the formulas related to the Status article and determine the best one (the one with the least MAPE=Mean Absolute Percentage Error).
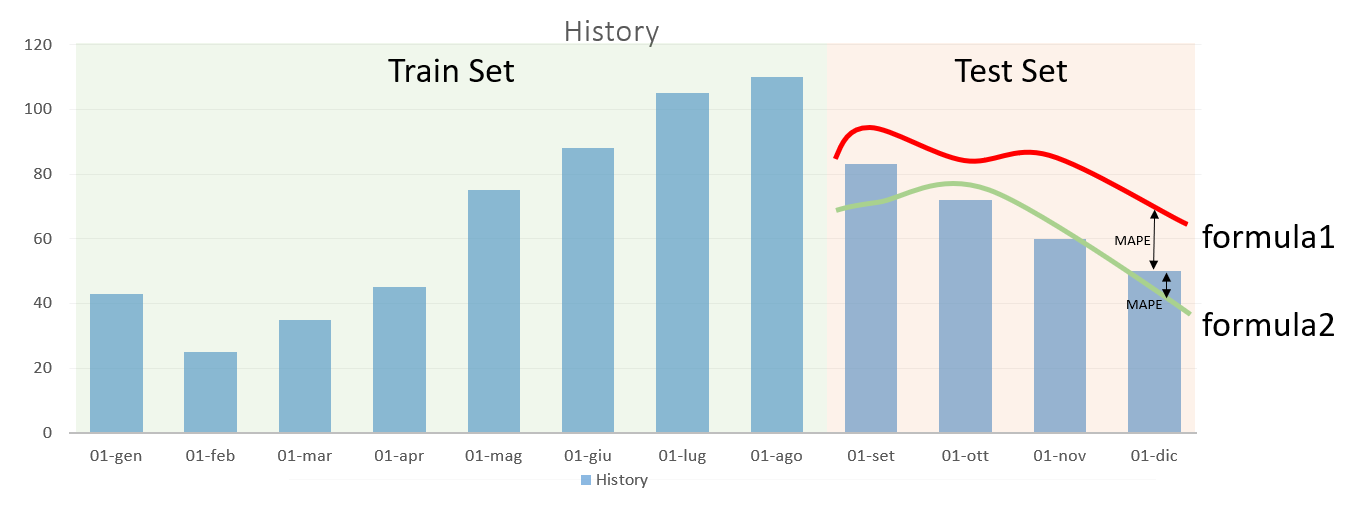
The low MAPE determines the best formula.
Press Analyze Data and enter the desired filters:
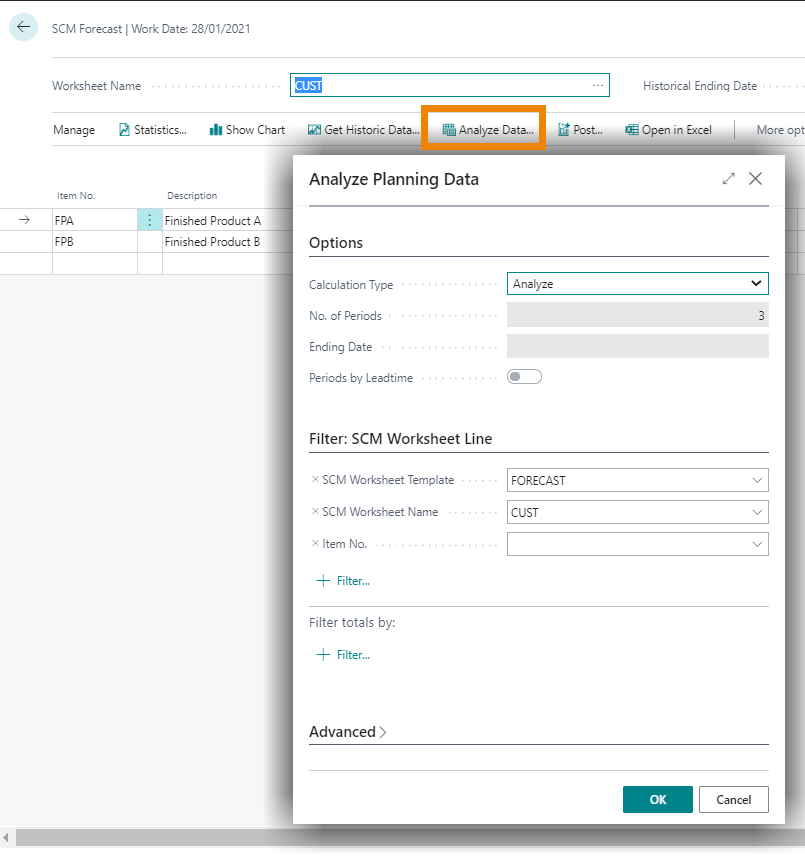
You can schedule this report from the job queue.
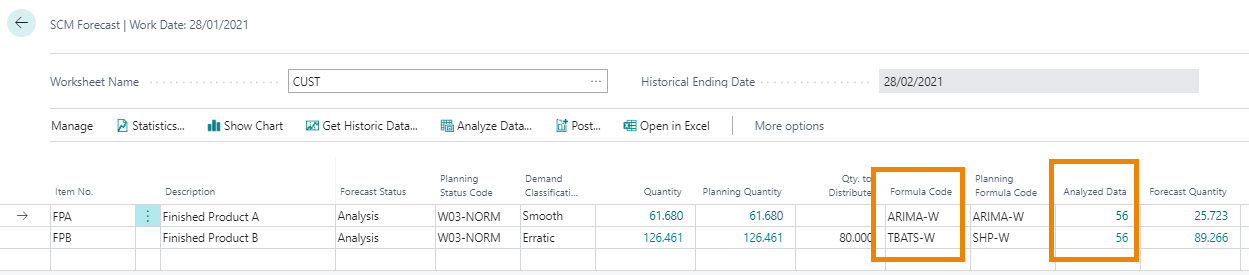
The system shows the formulas for each item and the number of items analized:
In the SCM Forecast page there are two fields that show the Formula:
| Field | Description |
| Formula Code | indicates the formula calculated by the system |
| Planning Formula Code | indicates the formula entered in the Item card in the field "Forecast Formula Code".If set, it prevails over the Planning Formula Code. |
In the Analysis Data column you will find the detailed results of the analysis carried out by the system:
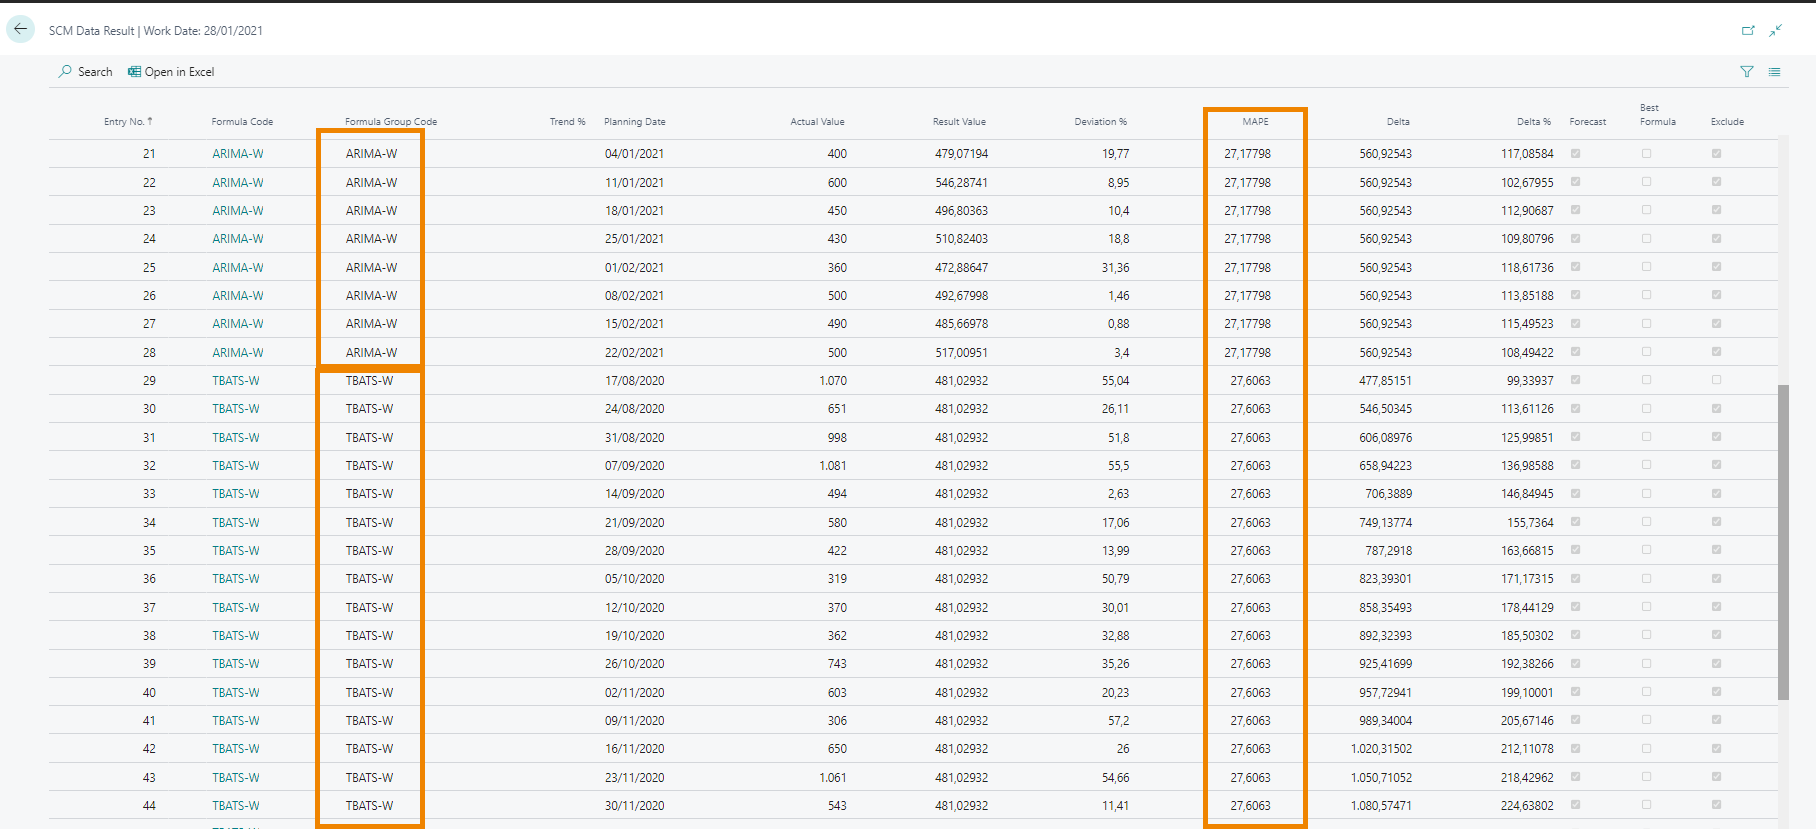
The ARIMA-W formula is the best because the MAPE is the least.
The system now applies the best formula.
To calculate the forecast e.g. for an item, for a period of 1 year (52 weeks), you need to press Analyze data and select "forecast" as Calculation Type (this procedure can also be scheduled in the job queue).
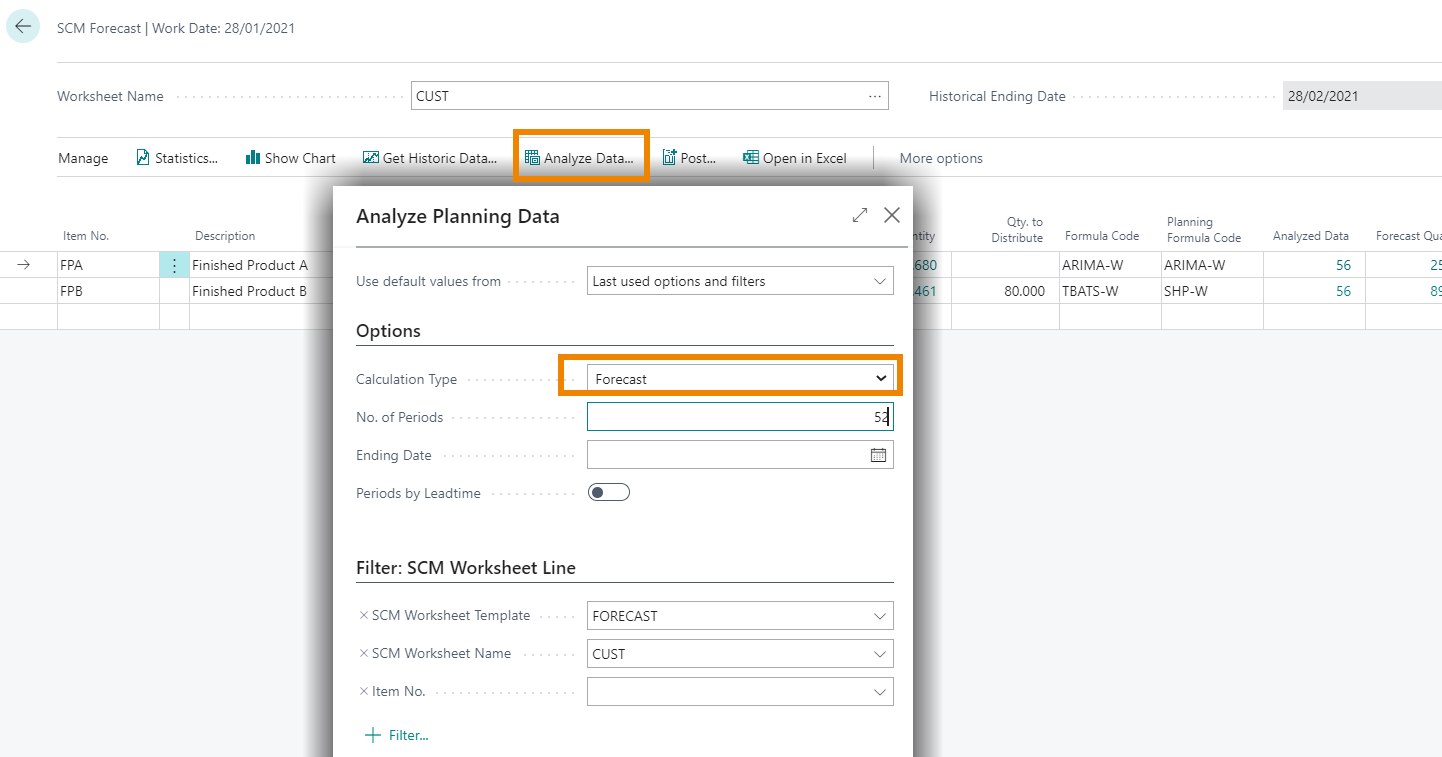
Press OK and the system start the calculation.
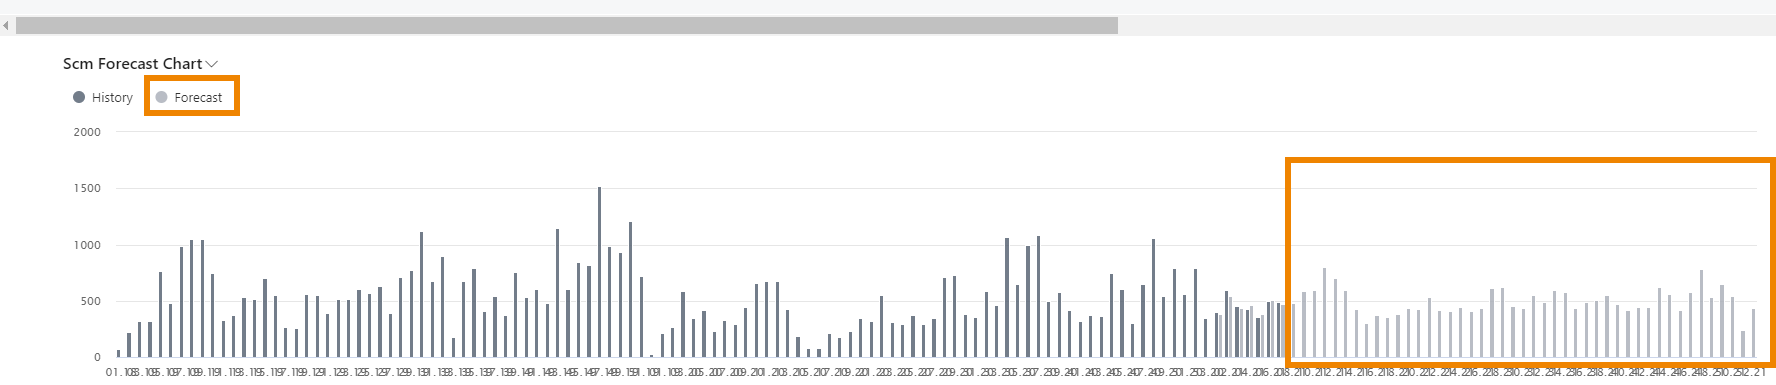
The Forecast is shown in the chart below:
On the lines the field Forecast Status has automatically changed (Analysis->Forecast)
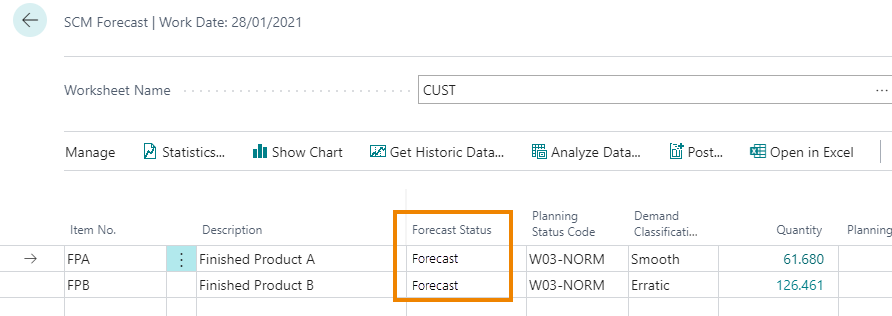
and by clicking on the Forecast Quantity field you can see the Forecast entries details.
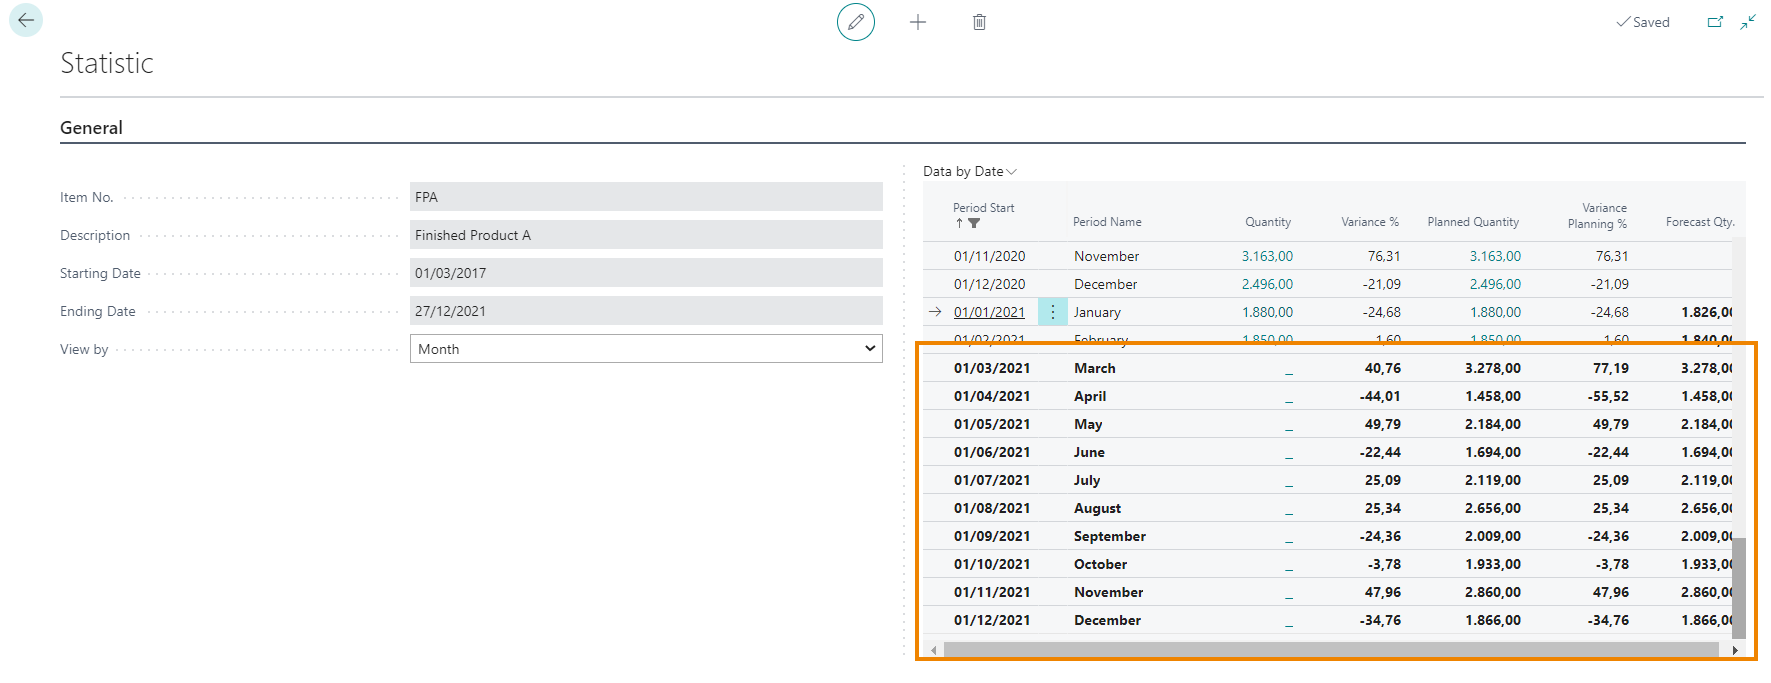
On the Statistics page the Forecast is now showed in bold:
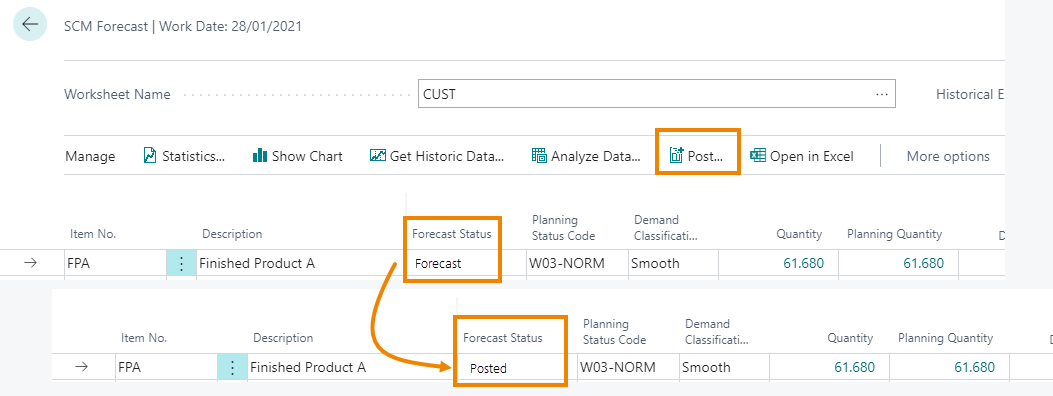
Post the forecast result, this creates the production forecast entries (Demand Forecast), that can be used in the planning calculation on the planning worksheet.
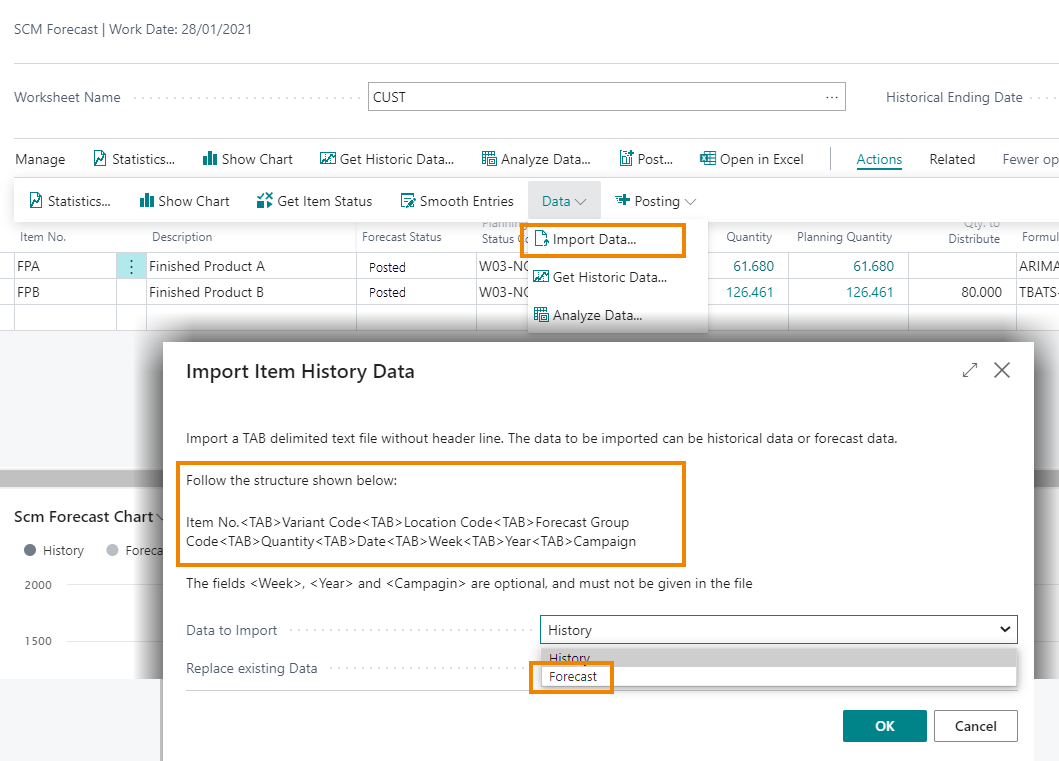
If we want to integrate the forecast with promotions previously entered in an Excel file and then converted in a .txt file, it is possible to import that file from Actions->Data->Import Data
and the system shows the modified entries with reference to the campaign:
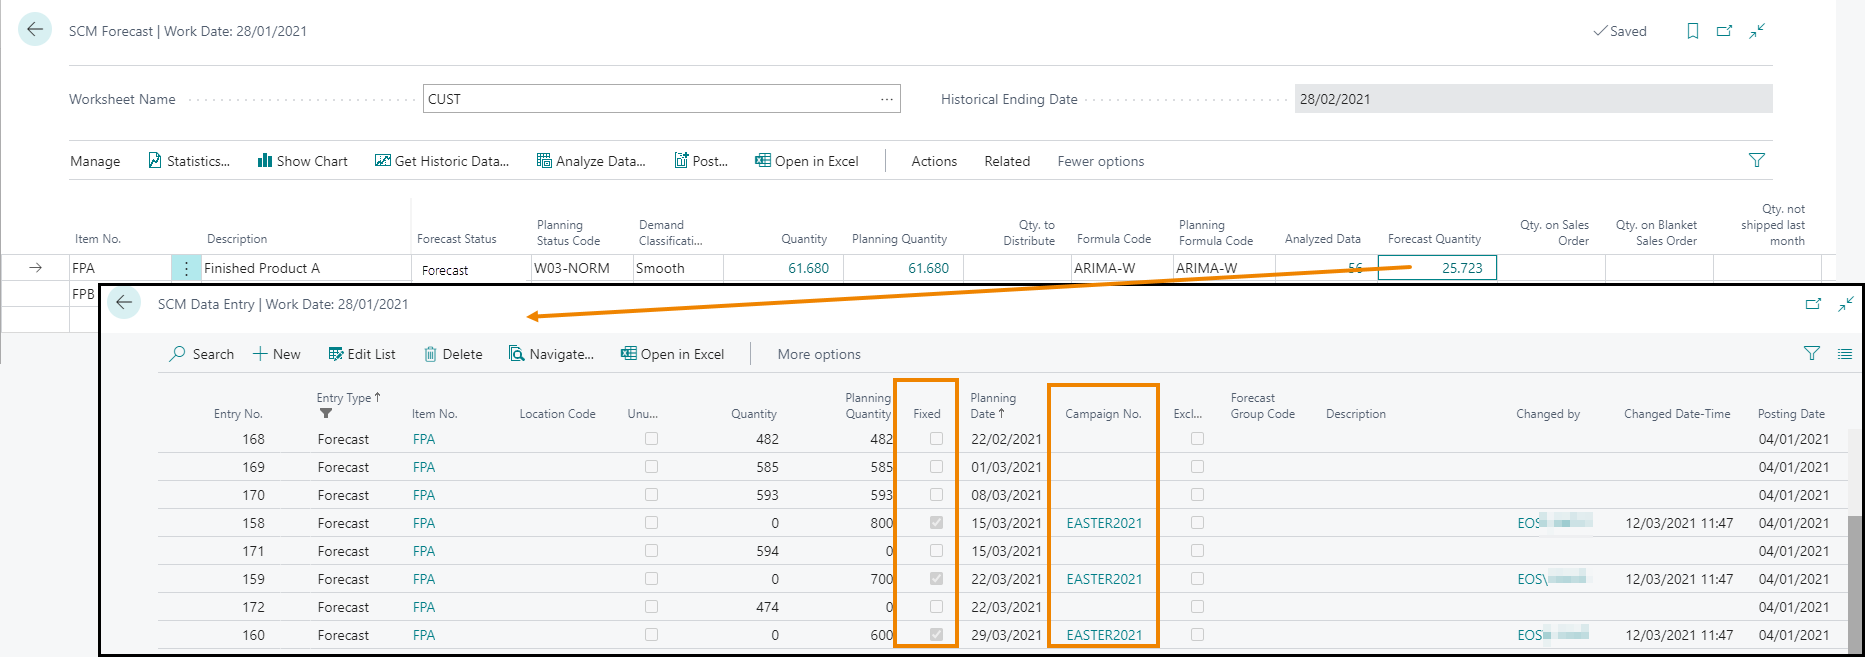
The data in the list are editable (press Edit List). All the changes need to be re-posted
See also: